


Vacanti begins Chapter 3 of Actionable Agile Metrics Volume II, Advanced Topics in Predictability by Daniel S. Vacanti, by reminding the reader: “A predictable process behaves in a way we expect it to.” Further a predictable process exhibits only routine variation. By definition, an unpredictable process exhibits both routine and exceptional variation. The manta of the book (it is in the title) is predictability, therefore tools that provide an understanding of when a process is predictable or not are critical. In this chapter Vacanti reintroduces the Process Behavior Chart (PBC) we saw in Volume 1 of the book. The explanation in this chapter opened my eyes to how to create and interpret this chart.
Why is what seems to be an esoteric discussion about routine and exceptional variation and predictability important? How many of the following questions have you heard in the last week?
- When will you be able to start this “thing”?
- How much will this cost me?
- When can this “thing” be delivered?
- Can you commit to these stories?
- When will this work be done?
Substitute any real piece of work for the word “thing” and I am going to guess that you hear these questions multiple times a day. I certainly hear them being asked. I can guarantee that when the answer isn’t what someone wants to hear they push back or go ask someone else. Answering any of these questions honestly requires an understanding of variation and predictability. Unfortunately, these are concepts that very few people understand so almost all answers are given with a nod and wink (or hope and prayer).
Vacanti uses Wilt Chamberlien’s free throw shooting to illustrate the difference between routine and exceptional variation. We will use the labor participation rate of 25 to 34 year-olds over the past five years. My wife originally pointed the chart out after reading What Social Trends Taught Us About the 2023 Economy (New York Times). The following chart is from the Bureau of Labor Statistics (12/23/2023)
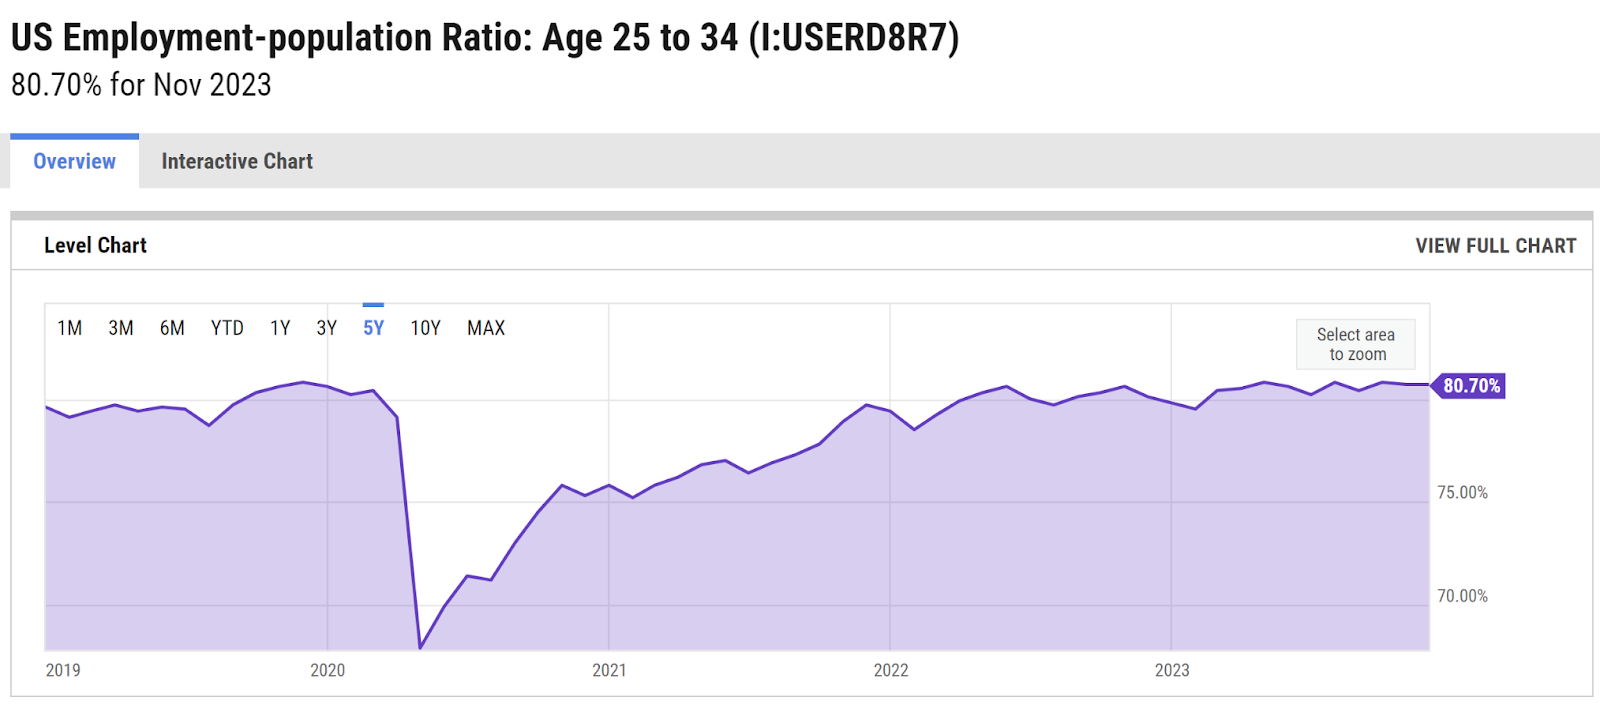
After downloading the data and putting it into an x-y chart (also known as a run chart) yields:
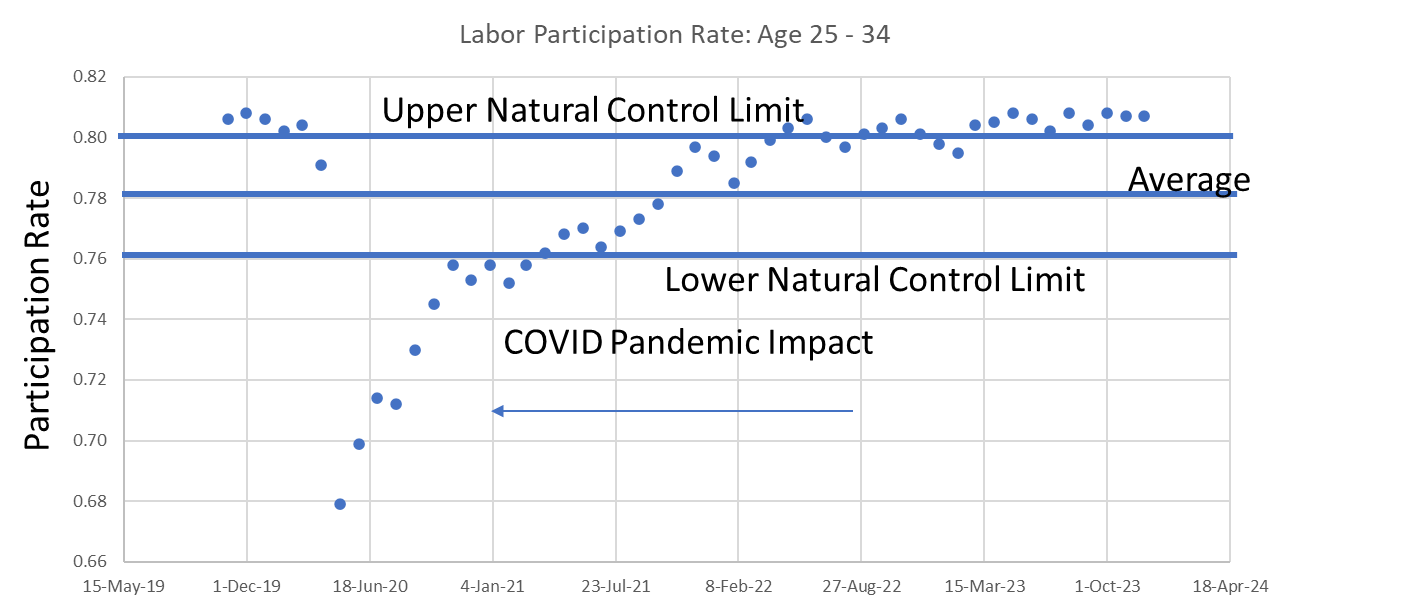
I have added natural control limits to the run chart so that we can see that the US Labor Participation Rate for 25-34 year-olds when viewed from October 31 2019 through November 30 2023 is not predictable. The COVID pandemic introduced a lot of exceptional variation. The pandemic created a “signal” – it is an exception (or as Deming would have said special cause). If this was delivery flow data, the signal screams “Fix This!” We can only become predictable by finding and fixing exceptional variation so that the process returns to routine variation.
We will construct the full XmR chart (with some background information) and discuss natural control limits in Chapter 4.
Buy a copy and get reading – Actionable Agile Metrics Volume II, Advanced Topics in Predictability. The current re-read entry
Week 1: Re-read Logistics and Preface – https://bit.ly/4adgxsC
Week 2: Wilt The Stilt and Definition of Variation – https://bit.ly/4aldwGN


