


This week we begin the read of Actionable Agile Metrics Volume II, Advanced Topics in Predictability by Daniel S. Vacanti in earnest covering Chapters One and Two. These two chapters provide a statistical cautionary tale and then go on to define variability. The definition of variability is a foundation that much of AA Volume II builds on.
Chapter 1 – Wilt the Stilt
Chapter 1 is a cautionary tale of how statistical differences can be misinterpreted. Malcolm Gladwell assigned the events of March 2, 1962, where Wilt Chamberlain scored 100 points in an NBA game, to how he shot free throws. Dan Vacanti reviews the same data and sees normal variation – nothing exceptional. I have listened to Gladwell’s podcast on the topic (great podcast) and have listened to Vacanti present on the topic at an agile conference (great presentation). Vacanti’s book also contains the data and I am no slouch with statistics and quantitative and can test both assertions. One is a great story and one is statistically correct. The punchline…understanding variability provides a way to see the signal in the noise.
Chapter 2 – Variation Defined
All processes display some variation. As a podcaster, I track the first downloads over seven days from release. Over the past few years, the first-week numbers have shown a 20% variation. First-week numbers inside that 20% range are normal. A few weeks ago when I checked the numbers they were well below the 20% range. The observation popped up (down actually) from the signal generated by the process, it was something I had to dig into. The root cause was that one of my websites had failed to post the cast, something unique had occurred. Filtering out the noise allowed me to identify the signal; getting rid of noise is a critical first step in using data. Having collected data, I was able to build a filter that would not be possible if I only had one or two observations and an average.
Several ideas struck me as I read this chapter. One of the concepts that struck me was that as humans, as soon as we make a comparison we are making assumptions about what is good or bad. Making assumptions generates an anchor bias and pushes our mental models toward validating our assumptions. This is one of the reasons why humans tend to see patterns when they don’t exist.
Deming has had a major impact on my thinking since I was exposed to his work in the 1980s. Because of that exposure, the concept of two types of variation is not new to me but maybe to those who have not studied Deming, Shewhart, or Wheeler. The two types are:
Routine Variation is caused by the ‘normal operation” of a process or system. As Vacanti notes, routine variation is the noise in your data. As a side note, to change noise in the process means changing the processes or organization.
The second type of variation I have always called special cause (Deming’s words), Vacanti uses the phrase Exceptional Variation (Wheeler). A shock to the system causes this type of variation, Vacanti calls these shocks, a single dominant issue. The following chart shows a time series of Class A office vacancy rates in major midwestern cities.
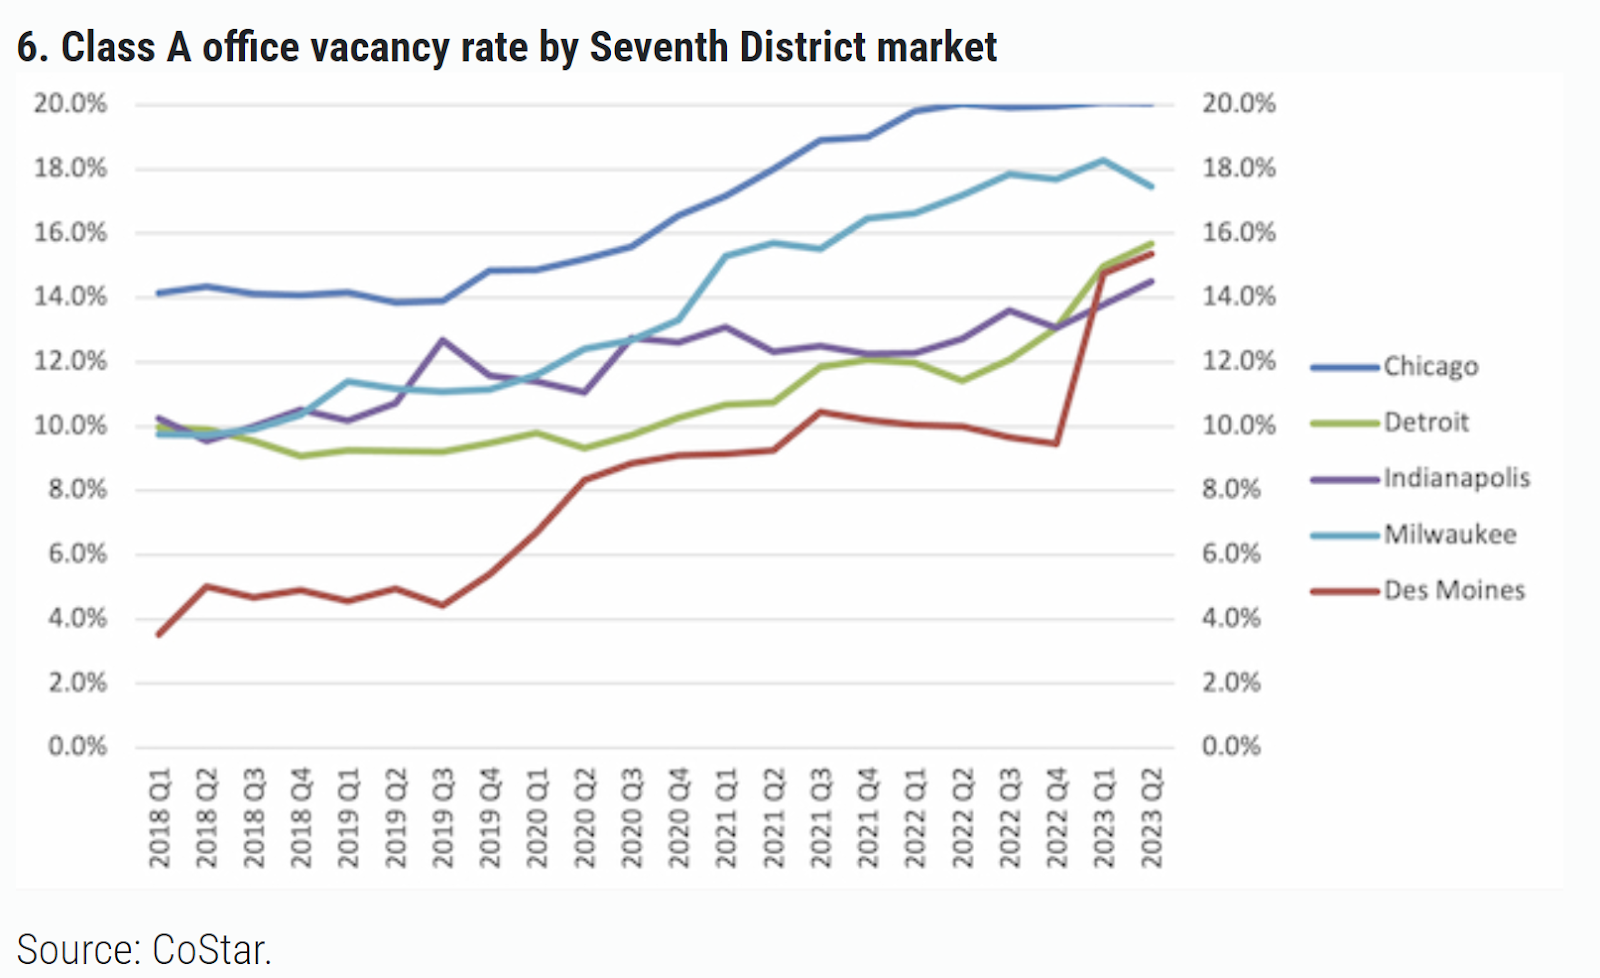
https://www.chicagofed.org/publications/blogs/midwest-economy/2023/office-space-trends-seventh-district
The data for Class A office space includes noise and signal (while our brains scream signal let’s hold off making decisions until we do the math in later chapters). As a side note, the inability to wait to do the math is why people get themselves into trouble. I have acquaintances who won a substantial portion of a lottery pool only to lose it all through day trading based on patterns in the data. The same mistake can be made when analyzing lead time or throughput data.
Sorting out the difference between the two types of variation has been important to humans from the beginning of time. For example, let’s imagine walking through the grasslands of India. Being able to recognize the pattern of a Bengal Tiger hiding in the grass would improve your chances of survival. This is separating signal from noise.
Chapter 3 discusses the relationship between variation and predictability.
Buy a copy and get reading – Actionable Agile Metrics Volume II, Advanced Topics in Predictability. The current re-read entry
Week 1: Re-read Logistics and Preface – https://bit.ly/4adgxsC


